- English
- Chinese
- French
- German
- Portuguese
- Spanish
- Russian
- Japanese
- Korean
- Arabic
- Irish
- Greek
- Turkish
- Italian
- Danish
- Romanian
- Indonesian
- Czech
- Afrikaans
- Swedish
- Polish
- Catalan
- Esperanto
- Hindi
- Lao
- Albanian
- Amharic
- Armenian
- Azerbaijani
- Belarusian
- Bengali
- Bosnian
- Bulgarian
- Cebuano
- Chichewa
- Corsican
- Croatian
- Dutch
- Estonian
- Filipino
- Finnish
- Frisian
- Galician
- Georgian
- Gujarati
- Haitian
- Hausa
- Hawaiian
- Hebrew
- Hmong
- Hungarian
- Icelandic
- Igbo
- Javanese
- Kannada
- Kazakh
- Khmer
- Kurdish
- Kyrgyz
- Latin
- Latvian
- Lithuanian
- Luxembou..
- Macedonian
- Malagasy
- Malay
- Malayalam
- Maltese
- Maori
- Marathi
- Mongolian
- Burmese
- Nepali
- Norwegian
- Pashto
- Persian
- Punjabi
- Serbian
- Sesotho
- Sinhala
- Slovak
- Slovenian
- Somali
- Samoan
- Scots Gaelic
- Shona
- Sindhi
- Sundanese
- Swahili
- Tajik
- Tamil
- Telugu
- Thai
- Ukrainian
- Urdu
- Uzbek
- Vietnamese
- Welsh
- Xhosa
- Yiddish
- Yoruba
- Zulu
- Kinyarwanda
- Tatar
- Oriya
- Turkmen
- Uyghur

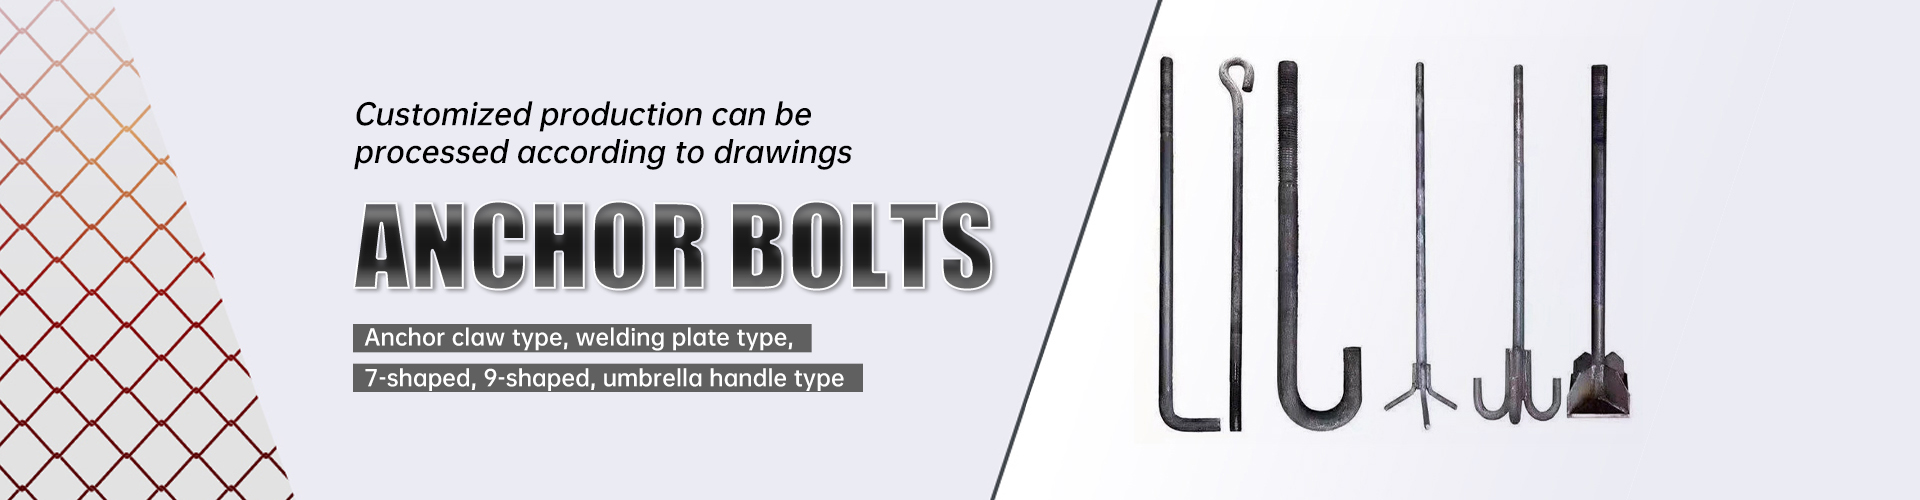
indices
When most people hear 'indices', they think of stock markets or economic indicators. In the manufacturing trenches, especially in a place like Yongnian, it means something far more granular. It's the pulse of production, the quantified reality of material flow, machine hum, and logistical dance. A common mistake is to treat these indices as mere reporting tools—a dashboard for management. That's a superficial view. In reality, a well-structured set of operational indices is the control panel for the entire factory floor. It tells you not just if you're profitable, but why a specific batch of fasteners had a 0.5% higher defect rate on Tuesday afternoon, and whether it correlates with a slight temperature fluctuation in the heat treatment workshop. The data isn't abstract; it's physical, tied to the weight of steel wire and the wear on a heading machine's dies.
The Tangible Foundation: Location and Logistics Indices
You can't talk about production indices without first understanding the foundational ones: logistics and geography. This isn't textbook theory. Take our location. Being in Yongnian District, Handan, adjacent to the Beijing-Guangzhou Railway and National Highway 107, isn't just a line in a company profile. It translates into specific, monitored indices: inbound raw material lead time variance, outbound container loading turnaround time, and even a regional traffic congestion index that our logistics team watches daily. For a company like Handan Zitai Fastener, these external indices directly feed into internal production scheduling. A delay on the 107 can mean a forging line runs below capacity for four hours. We learned to factor that in, creating a buffer index based on historical delay data from our own shipping logs.
The website, https://www.zitaifasteners.com, lists our location advantages, but the real story is in the indices we built around them. We track a Transportation Reliability Index for each major route. It sounds fancy, but it started as a simple spreadsheet logged by the warehouse foreman. He'd note when trucks from the steel mill were late, the reason (if known), and the impact. Over months, patterns emerged. This index now automatically adjusts our safety stock levels for key wire rod diameters. It's a living metric, not a static fact.
This geographical advantage also creates a baseline expectation. Because transportation is theoretically efficient, any dip in our internal On-Time In-Full (OTIF) delivery index to clients is immediately scrutinized. The assumption is: We have no excuse on the logistics front, so the problem must be internal—production or quality. It forces a deeper dive into other operational indices.
Production Floor Indices: The Devil's in the Details
Moving inside the plant, the indices get dirtier, literally. Overall Equipment Effectiveness (OEE) is the big one, but it's almost useless if taken at face value. A plant-wide OEE of 78% tells you nothing. The truth is in the decomposition. We break it down by fastener type and even by machine cluster. The index that matters more to our line supervisors is the Tooling Wear Rate Index. For cold forging, the wear on a die or punch doesn't follow a perfect linear curve. We developed an index that combines units produced, material hardness batch number (from the mill certificate), and a weekly micrometer check. It’s predictive. We can now schedule tooling changes with 95% accuracy, avoiding catastrophic failure that scraps a thousand pieces and halts a line.
Another critical, often overlooked set is the environmental indices within the workshop. Fastener manufacturing, particularly heat treatment and plating, is sensitive. We monitor a simple Ambient Particulate Index near the plating tanks. A spike often precedes a slight increase in coating adhesion failures a day later. It took us two years and one major customer return to correlate those data points. Now, that index is part of the pre-shift checklist for the plating department.
Yield indices are standard, but we drill into first-pass yield versus final yield after rework. The gap between those two numbers is a cost index in disguise. A high final yield but low first-pass yield means you're spending disproportionate energy and labor on sorting, re-threading, or re-coating. We chased final yield for years until a cost analysis showed the hidden drain. Now, the First-Pass Yield Index is the primary driver for process engineering bonuses.
The Quality Labyrinth: Beyond Pass/Fail
Quality control generates a waterfall of indices, most of them noise. Tensile strength, hardness, salt spray test hours—they're all tracked. But the index that changed our approach was the Process Capability Index (Cpk) trend for dimensional tolerances. We used to just check if parts were within spec. Calculating Cpk for critical dimensions, like thread pitch or head height, showed us how close we were skating to the edge of the tolerance band. A Cpk trending downward, even while all parts were in spec, was an early warning of tooling wear or machine drift. It moved us from reactive quality control to preventive.
We also created a somewhat unconventional Customer-Specific Requirement Index. Some clients, especially in automotive or construction, have unique packaging, labeling, or certificate requirements beyond the physical product. Failure here is just as costly as a quality failure. This index tracks errors in these ancillary requirements. It's managed by the shipping office, not QC, and it dramatically reduced those frustrating non-quality rejections that infuriate the sales team.
A failure worth mentioning: we once tried to implement a monolithic, real-time Factory Health Index on a giant dashboard. It aggregated dozens of metrics into a single red/amber/green score. It was a disaster. It was too abstract. The line staff ignored it because it didn't relate to their immediate tasks, and management couldn't act on it because the root cause was buried in the aggregation. We scrapped it after six months. The lesson was that effective indices must be owned and understood by the team whose actions directly influence them.
Linking Indices to the Market: The External Feedback Loop
Internal indices only have meaning if they connect to external reality. For a manufacturer like Zitai, the ultimate external indices are customer order patterns and raw material price volatility. We don't control these, but our internal indices must respond to them. We developed a simple Order Complexity Index based on the mix of standards (like DIN, ASTM), sizes, and finishes in a given week. A high index value means more changeovers, which should correlate with a planned decrease in overall equipment efficiency (OEE) for that period. If it doesn't—if OEE stays high amid high complexity—it might indicate rushed changeovers that risk quality, which we then cross-check against the first-pass yield index.
Raw material, primarily steel wire rod, is our biggest cost. We track global steel price indices, of course. But more importantly, we track our own Material Utilization Index (scrap rate) against those price movements. When input costs rise, the financial impact of a 1% increase in scrap is magnified. This index suddenly gets more attention in production meetings, and tolerances for machine setup might be tightened, affecting the tooling wear index mentioned earlier. Everything is connected.
The company's online presence at Zitai Fasteners is itself a source of a soft index. Web analytics provide a Inquiry-to-Specification Detail Ratio. A surge in traffic to pages detailing high-strength structural bolts, coupled with detailed specification sheet downloads, often precedes formal RFQs from construction or infrastructure sectors by weeks. It's a leading indicator for our sales and production planning teams, hinting at where to focus capacity.
Synthesis: The Indices as a Narrative, Not a Report
In the end, a collection of indices is not a report card; it's the ongoing story of the factory. The plot twists are the correlations and anomalies. For instance, a dip in the Transportation Reliability Index from the north might coincide with a slight rise in raw material hardness from a mill in that region (tracked via our mill certificate database index), leading to a subtle increase in tooling wear on the 4 heading machine. You see the cascade?
The goal isn't to have hundreds of perfect indices. It's to have a few dozen robust, trusted ones that the teams believe in. They must be slightly imperfect, constantly tweaked, and occasionally retired. The data comes from the shop floor—from calipers, scales, timers, and logbooks. It's manually entered sometimes, prone to human error, which you must account for. That imperfection is part of its authenticity.
So when I think of indices at Handan Zitai Fastener, I don't see spreadsheets. I see the foreman frowning at a trend line on a whiteboard, the logistics manager calling the highway patrol to check on a delay, and the quality head correlating a humidity sensor readout with a batch of slightly discolored zinc plating. It's the quantified language of making things, of turning steel wire into reliable fasteners, day after day. The indices are the score, and the production floor is the orchestra, constantly tuning its performance.
Lotinduta aurrealdi
Lotutako produktuak


Salmenta onena aurrealdi
Salmenta produktu onenak-
 Elektrokatutako galbanizatuzko gasak
 - Elektrogalizazio gurutze-zulagailu haria
- Electro-Galvanized Cross Cross Bolts
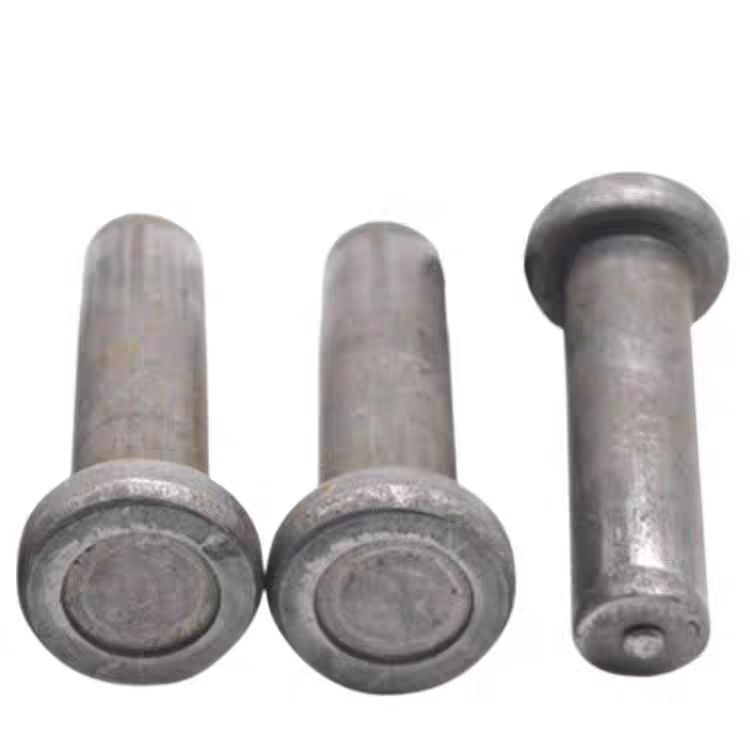
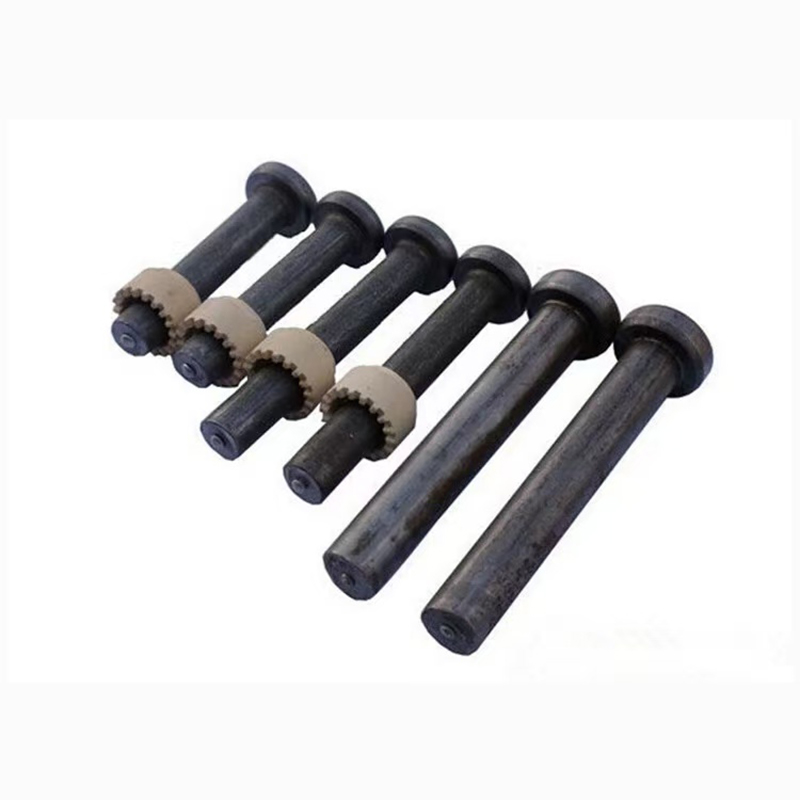
- Steel structure welding studs
- T-Bolt (T-Slot Bolt)
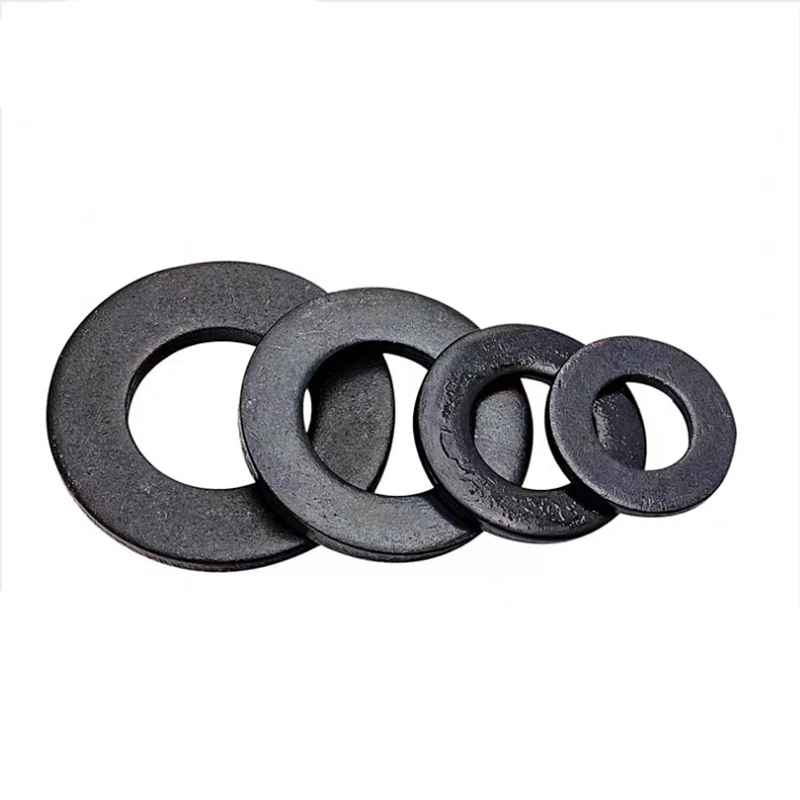
- Indar handiko beltzeko juntadura
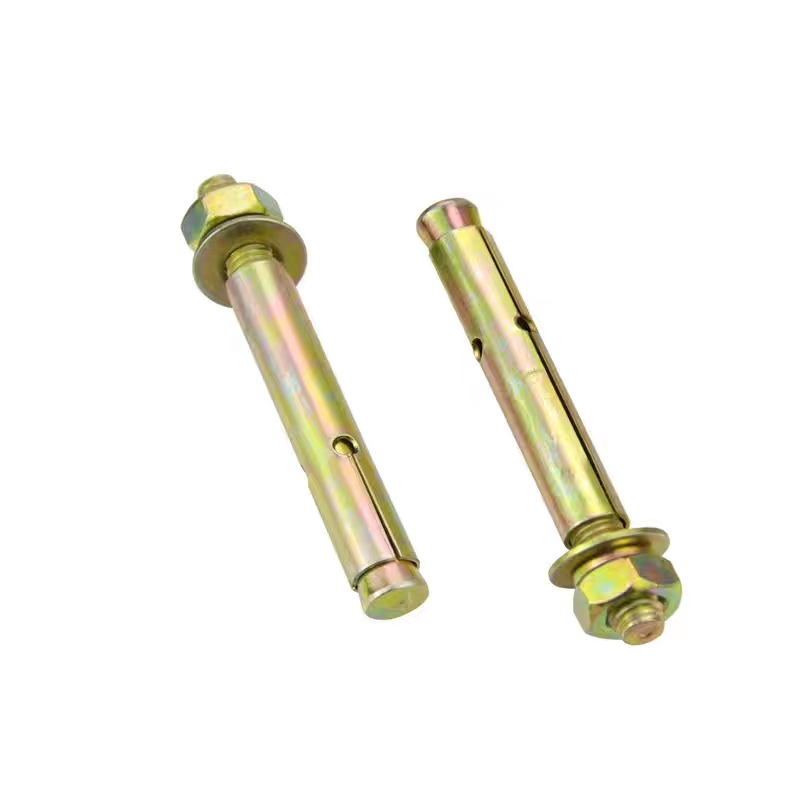
- Koloretako zinka estalitako hedapen boltxoak
- Zulagailu hexagonal elektro-galvanizatua
- Soldadura iltzeak
- Elektrogalizazio fruitu lehorrak
- Hexagon entxufe zinka beltzeko torlojuak
- Elektrogalizazio kimiko kimikoak